Have you ever wondered why your tweets aren’t reaching as many people as you thought they would? Do you wonder why some seem to reach more people than others? There have been times when I’ve written a blog post like this one that I thought would add amazing value to the effectiveness of a church’s social media strategy, but for some reason when I tweet it out it doesn’t spread as far as I had hoped.
Many people have a set and forget mentality to social media. They think they deserve to be shared, liked, retweeted, +1 and whatever happens, happens. But what if I told you could improve your reach, grow your audience and increase your effectiveness of your tweets? Would you like to improve with any of those?
You are what you measure right? You can only improve if you know what your starting points are. Analytics are the key to first understanding your current situation, then adapting and learning what your optimum post times and types are from there.
Facebook makes it easy for you to look at the best times to post for Facebook pages. It’s insights drill down to a level of granular detail that is unparalleled in my opinion. You can get all kinds of amazing insights into who your audience is, when they are online, how your posts are performing, How many people clicked through to your website. It’s amazing.
But this post isn’t about Facebook. It’s about Twitter.
Introducing Twitter Analytics
Did you know that Twitter has free built-in analytics so that you can measure your post performance? It is a little known feature that absolutely rocks. You can then review and understand your optimum time of days to post on the platform. What kinds of posts are resonating with people. How many people your post reached. You can find yours by copying and pasting this link below in your browser and inserting your name into this link.
https://analytics.twitter.com/user/insertyourname/tweets
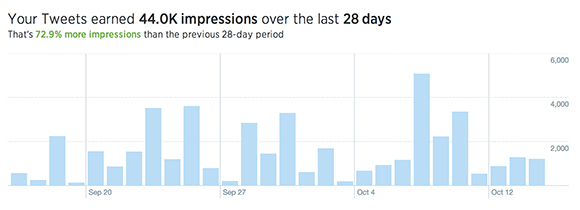
Here is a quick overview of Twitter’s Analytics from my personal Twitter account:
Analytics Overview For 28 Days
I love how you can see your activity and reach over a month. It means that I can go back and analyse that day of my spike and ask why I reached so many people on that day.
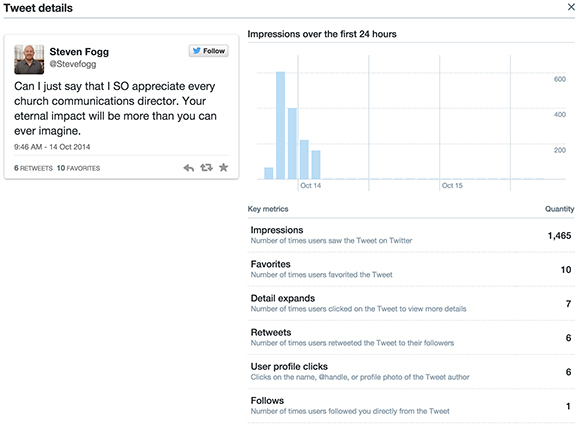
Analytics Overview For Individual Tweets
As you can see on this post I can see how many people saw the post, how many engaged with the post and the total percentage of who interacted with the post.
(By the way, if you agree with this tweet above, I’d love for you to share it with your tribe. I think so many church Communications Directors are undervalued and deserve encouragement)
These analytics are so cool. In real-time I can see this tweet’s reach, engagement and who were influential in spreading the love over time of a particular time period. Amazing. My screen grab didn’t capture one called ‘Shared by email’ I had one share on that. Amazing.
On your Twitter Analytics page you will see another page called ‘Followers’. This page will show your followers:
- Profile growth
- Top ten interests
- Location
- Gender
- Who your followers also follow
We may cover that another time as this page tells a completely different story.
Summary
Now I may be late to the party on this. I have no idea how long the analytics have been there. But here is how using these analytics you can become more effective on Twitter:
1) Check out who interacts with your posts over time or on individual posts. They are your tribe. They are your influencers. Engage with them! Show them the love Jerry! (sorry about that, I’m getting carried away)
2) Look at what kind of tweets travels the furthest. Create more of that content.
3) Review the times of the posts that have the most engagement and impressions. You may learn what your most effective tweet times are.
You can undertake many of these strategies on awesome paid plans like Hootsuite and SproutSocial. But we all love it when we can get ahead for free right?
Your Turn
Do you have any questions of queries? Agree or disagree? I’d love to hear from you. Drop a comment below. If you are a first time visitor especially I LOVE hearing from you :).


